ENGINEERING GUIDE · SEAWATER RO PRETREATMENT
Protect the membrane before pressure begins.
Reliable SWRO starts at the intake. Identify what can foul, scale, damage or destabilise the membrane—then build only the barriers the verified source requires.
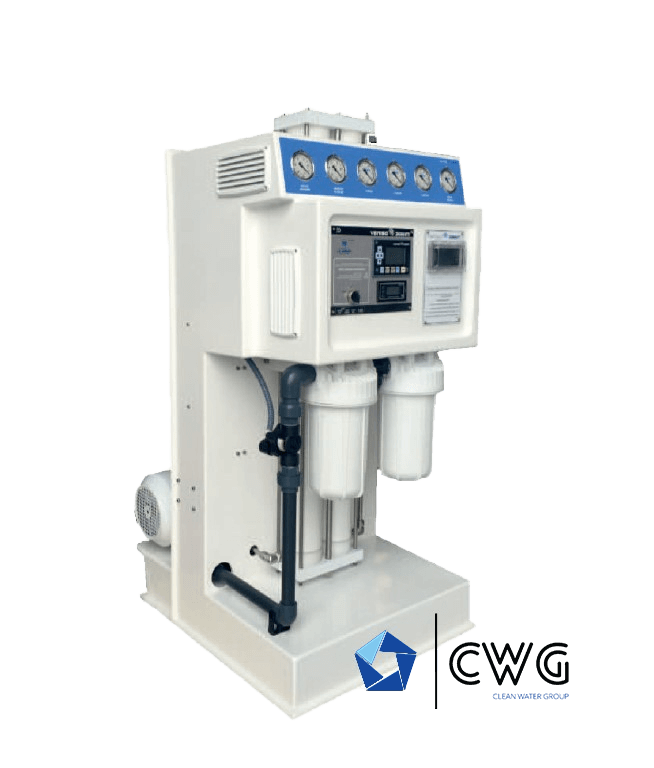
Pretreatment controls the feed condition that reaches the high-pressure pump and RO membrane.
Its job is not to make seawater “look clear.” It must reduce the specific particulate, colloidal, biological, chemical and compatibility risks demonstrated by the intake and representative source data.
INTAKE FIRST
The abstraction route changes the pretreatment problem.
Two plants with the same nominal SWRO capacity may need very different upstream processes because their sources behave differently.
Open seawater intake
Direct exposure to tides, weather, suspended matter and biological activity.
Characterise variability, screen the intake and verify the required solids and biological-control barriers.Beach well or subsurface intake
Natural subsurface filtration can reduce suspended loading, but chemistry and source behaviour remain site-specific.
Verify well yield, sand carryover, metals, scaling chemistry and seasonal conductivity rather than assuming clean feed.Harbour, marina or variable coastal source
Potential exposure to fine solids, organics, hydrocarbons, vessel activity and rapid water-quality changes.
Use representative sampling and define additional barriers only from measured contamination and operating risk.SOURCE-TO-BARRIER MATRIX
Treat the mechanism—not the label.
A treatment step belongs in the process only when the water data, intake behaviour or operating duty justifies it.
Send water analysis| Risk | Evidence to review | Engineering response |
|---|---|---|
| Coarse and suspended solids | Intake survey, turbidity, suspended solids and filter loading | Screening and staged filtration selected for the measured particle burden |
| Fine colloidal fouling | SDI where relevant, turbidity trend and membrane-feed behaviour | Media, membrane or other clarification route based on the verified duty |
| Biological activity | Source history, microbiology, organics, temperature and seasonal events | Compatible biological-control strategy with defined monitoring and membrane protection |
| Scaling chemistry | Calcium, magnesium, alkalinity, sulphate, silica, pH and intended recovery | Recovery limit, compatible dosing or other treatment confirmed by design review |
| Oxidant exposure | Disinfection plan and residual oxidant at the membrane boundary | Controlled neutralisation and verification before oxidant-sensitive membranes |
| Oil or process contamination | Intake location, visual condition, source events and targeted analysis | Source control and project-specific treatment; standard filtration is not assumed sufficient |
MEASURE THE FEED CONDITION
Build a baseline the operator can defend.
Single readings cannot explain a variable seawater source. Combine laboratory data, intake history and operating trends so filtration loading and membrane-feed quality are visible.
Chemistry, metals, nutrients, organics and relevant contamination indicators.
Related indicators with different meanings; neither replaces source characterisation.
Sampling must represent the conditions the plant is expected to operate through.
Use trends across filters and pretreatment stages to detect loading and abnormal behaviour.
Temperature and organic availability can change the operating risk over time.
The high-pressure section starts only when the approved feed conditions are satisfied.
TURBIDITY ≠ SDI
Related evidence. Different questions.
Turbidity describes optical scattering by material in the water. SDI is an operational test index associated with plugging tendency under the test conditions. Neither value alone identifies every particle, colloid, organic or biological risk.
Use both where relevant, track their variation and interpret them with the intake, laboratory analysis, filtration behaviour and membrane limits.
Useful for source and filtration trends; not a direct substitute for SDI.
Useful at defined sampling points; not a complete fouling diagnosis.
Trend across each barrier to reveal loading, blockage and abnormal change.
CHEMISTRY + RECOVERY
Scaling risk is created by concentration—not feed salinity alone.
As permeate is produced, retained constituents become more concentrated. The allowable recovery and any compatible conditioning must therefore be checked against the complete chemistry, temperature, membrane limits and concentrate route.
Engineering boundary
No universal recovery, antiscalant dose, acid dose or cleaning interval is published here. These values require verified project data and the approved technical proposal.
Open recovery flow-balance calculatorVERIFIED SEAMASTER SWRO ROUTES
Pretreatment follows the source across every plant format.
Published capacity ranges position the platform. They do not prescribe one pretreatment train or guarantee performance.
DESAL-SWRO PM / PM-C
62.5–1,250 L/hCompact catalog seawater systemsPretreatment is matched to the actual intake and installation; the compact RO package does not make one universal upstream train valid.
Explore platformDESAL-SWRO XL · ENGINEERED
36–600 m³/dayProject-engineered seawater plantsThe continuous engineering envelope can include project-specific intake, filtration, dosing, CIP, controls and train architecture.
Explore platformBOX DESAL SWRO
100–1,200 m³/dayFactory-integrated containerized plantsThe confirmed platform can integrate multimedia filtration, dosing, cartridge filtration, RO, CIP and monitoring within the approved supply boundary.
Explore platformPretreatment, dosing, monitoring and interfaces are one engineered supply boundary.
The final proposal defines what is included upstream and downstream of the RO package.
COMMISSIONING + OPERATION
Record the clean operating baseline.
Startup data turns later pressure, flow and conductivity changes into useful evidence. Set approved operating windows, alarm logic, sampling points and maintenance responsibilities before routine service.
DATA FOR PRETREATMENT DESIGN
Describe the source, plant and site as one operating case.
Capacity alone cannot define the upstream process. Send the evidence needed to set barriers, hydraulics, control and availability.
SEAWATER RO PRETREATMENT FAQ
Answers before process selection.
01Why does seawater RO need pretreatment?
Pretreatment stabilises the feed and reduces measured fouling, scaling, biological and compatibility risks before the high-pressure pump and RO membranes. It protects availability and cleanability, but its exact design must follow the intake and source-water data.
02Is a cartridge filter enough before SWRO?
Not by default. A cartridge filter is normally a final protective barrier and useful diagnostic point. Whether it is sufficient depends on the verified upstream water condition and the complete approved process, not on cartridge rating alone.
03Are turbidity and SDI the same measurement?
No. Turbidity indicates light scattering from suspended material, while SDI is an operational index associated with plugging tendency under its test conditions. They can support the same review but are not interchangeable and do not replace a complete source assessment.
04Can one pretreatment train be used for every seawater intake?
No. An open intake, subsurface intake and harbour source can present very different particles, organics, biological activity and contamination events. The treatment barriers, doses, sequence and control points are project decisions.
05Does plant capacity determine pretreatment size by itself?
Capacity defines an important hydraulic duty, but it does not define the treatment process. Feed flow, source variability, filtration rate, backwash demand, redundancy, chemical contact, operating hours and the approved RO recovery must be evaluated together.
06When is the pretreatment design final?
Only after the intake, representative source-water data, plant duty, operating philosophy, membrane limits, discharge conditions, utilities and battery limits have been reviewed and incorporated into the approved technical proposal.
Engineer the complete SWRO water path.
Connect the intake, pretreatment, RO duty, product-water target and discharge boundary in one verified proposal.